11
Moving Average by Step: A Good Research Tool
What is average volume of 3:00 to 3:30 PM, over the pass 10 days?
What is average range of 9:30 AM to 9:45 AM, over the pass 20 days?
These are the questions that traders often ask when doing research on market statistics, in view of this we have created Moving Average by Step that will provide answer to these kind questions easily.
The following is an example that highlight time periods on a ES chart with above average advance or decline issues from the pass 10 days.
Initial chart
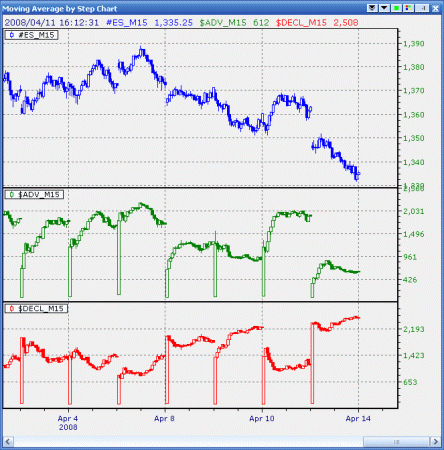
add 15 minute S&P mini, advance issues and decline issues into a time chart, into 3 different pane.
Add indicator
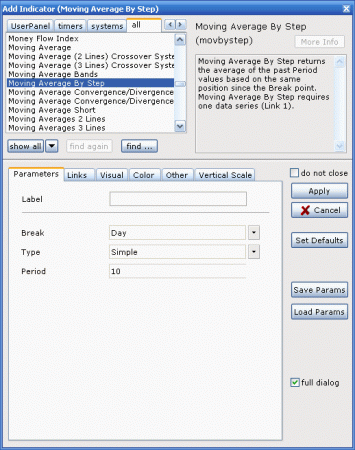
Next add moving average by step indicator to both advance issue and decline issue indicator, the parameters are set as:
Break: Day
Time preiod to look back on to get average value, Day is selected because we want to know pass 10 days advance and decline issues volume.
Type: Simple
Type of average that is used to calculate indicator value, simple moving average is used in this example.
Period: 10
Number of period to look back on.
Highlighting Data Bars
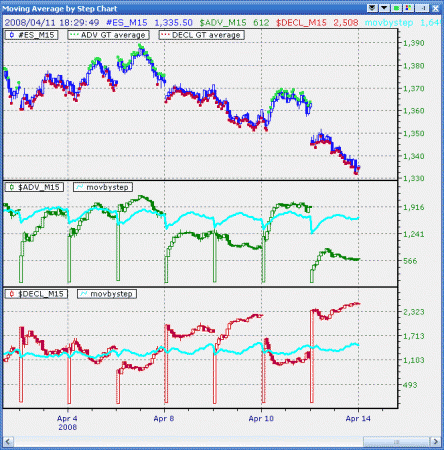
First I want to mark 15 minute periods that have higher than 10 days average advance issue from the pass 10 days. Use Hightlight Formula 2 set ES as first link ADV as second link, at formula enter the following formula:
data2 > movbystep(data2,"Day","Simple",10)
Next I want to mark 15 minute periods that have higher than average decline issues comparing against pass 10 days. Add another Highlight Formula 2 set ES as first link DECL as second link, at formula enter the following formula:
data2 > movbystep(data2,"Day","Simple",10)
Resulting chart is as follow:
I have attaced example chart group click here to download it to your local drive, and use Group> Import package to install the example group.
As for the two questions at the beginning:
1, Load 30 minute chart add moving average steps with parameters: (days, simple, 10), change link to volume then it will give the pass 10 days average volume.
2, Load 15 minute chart add range indicator and add moving average steps on range with parameters: (days, simple 20), this will return 20 days average range of all 15 minute periods.
Make sure sufficient days of data is loaded to get proper results from the indicator.


