21
Howto Build Calculated Symbols 2
This time around I will show how to build a spread symbol and a completely new method to fill in historical calculation that better emulate real time data building using lower time frame and compress series calls.
This example will attempt to compare cash value of ES and NQ, the formula to compare contract cash value spread is:
ES*0.5-NQ*0.2
Real-time: User Defined Symbol
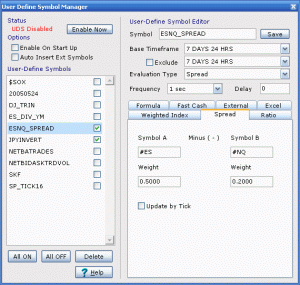
Open user defined symbol manager, start by creating a symbol I used ESNQ_spread because this name is representative of underlying calculation, you can pick anything you want when creating other user defined symbols.
Select and entry the following options:
Base Tiemframe: 7 DAYS 24 HRS
Evaluation Type: Spread
Frequency: 1 sec
Symbol A: #ES
Weight: 0.5
Symbol B: #NQ
Weight: 0.2
Click enable now and make sure user defined symbol is checked to start collecting real-time data.
Historical Data
In this section I will show how to use minute and tick data to reconstruct historical data.
One approach is use minute data bar open, high, low and close as one data point and do a simple subtraction of these four points and return a meta style indicator with four plots that emulate a data bar. The advantage of this approach is faster historical calculation and since minute data are more widely available than tick data longer history can be generated.
An example indicator (Example Formula Spread by Bar) that uses bar data point subtraction and plot result as candle in a new pane is available for download below. Two parameter are available for user to adjust weighting of the underlying instrument, default weighting values are weighting value of ES and NQ.
Another approach is use tick data to fill in open, high, low and close of a minute bar tick by tick, this approach product a result with better granularity but is more resource intensive and take longer to generate result. Also tick historical data do not usually go as far back as minute data, so historical regeneration could be limited.
Indicator (Example Formula Spread by Tick) that uses tick data with logic to compare tick data value to produce data bar result is available for download below. For this indicator to produce a correct result, a tick replay is required.
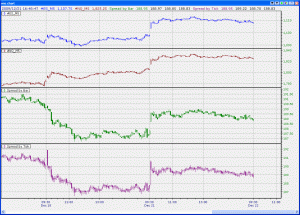
This is a chart that show a comparison of the two indicator result.
Download
Example Formula Spread by Bar (ex_for_spreadbybar.for)
Example Formula Spread by Tick (ex_for_spreadbytick.for)

