11
Dynamic Support Resistance Band Indicator
 Many traders use band type indicators, like Bollinger bands, Donchian Channels, etc. to analysis the direction of the current price movements. It is a very common form of technical analysis. The issue is, when plotting such indicators, both lines are plotted all the time and for many power users, they would like to focus on the line reflecting the proper direction of the market at the time only. I am going to introduce an indicator that can be used to display any bands with the ability to show only the significant line.
The basic 2 lines setup
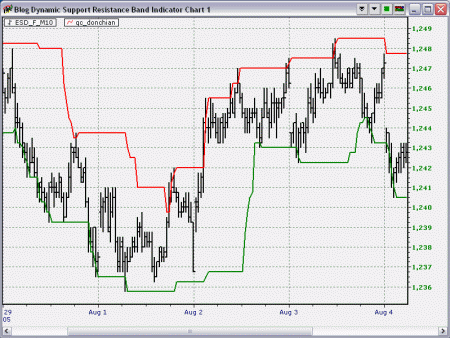
Here is a chart with the standard Donchian Channel, displaced 1 bar for better visualization of the price penetrations,
The chart looks alright in the current form we are showing, but, it does not serve its purpose for identifying the line of most significance. When we line up more time frames within the same chart, or, adding a few more variations of the Donchian Channel, then the chart will be very unreadable due to the number of lines showing on the chart.
An indicator that display only the significant line
Within the NeoTicker indicator formula language, you can control the plot series from displaying by utilizing the visualbreak properties.
For almost all the band based support resistance analysis, the user is interested only in the price level (indicator value) that is not violated. Thus, all we have to do is to construct a formula indicator that remember and update the state of the penetrated direction of the band, then we will be able to control which plot series to show.
Here is the code of the indicator,
plot1 := fml (1, data1, param1);

plot2 := fml (1, data1, param2);
dir := choose (c > plot1 (1), 1, c < plot2 (1), -1, dir (1));
visualbreak1 := dir >= 0;
visualbreak2 := dir < = 0;
The most important line within the indicator is the dir assignment statement. Notice that it utilizes the decision function choose and also the recursive value of the previous dir variable values.
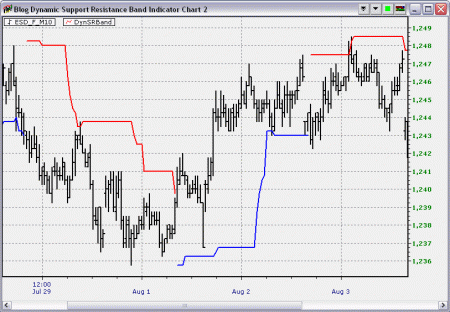
This single line of formula enabled us to property set the visual state of the two (2) band series, allowing for the proper visual effects that we wanted,
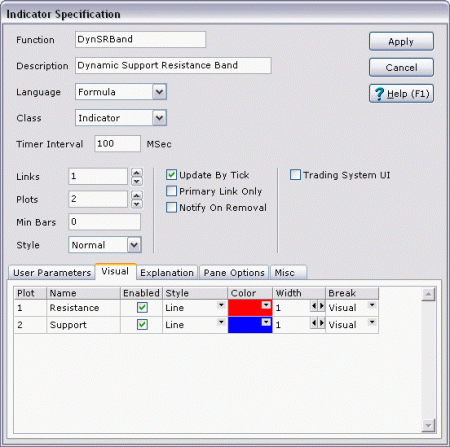
One thing to remember though, the indicator has to be defaulted to utilize the visual break in the Indicator Specification; otherwise, you will have to set that every time you add the indicator to a chart,
The indicator takes 2 parameters to define the upper and lower band series. Since Donchian channel is simply the highest high and lowest low of the price series over certain period, we've chosen to set parameter 1 as,
hhv (h, 20)
and parameter 2 as,
llv (l, 20)
to emulate the Donchian channel.
Variation of the band
Due to the fact that we have chosen to use formula parameters for our plot1 and plot2, it is possible to plot effectively any bands we want.
The following is an example using the Average Range Channel.
You can set parameter 1 of the indicator Dynamic Support Resistance Band to,
AvgRangeChannel.Plot2 (0,data1,9,2)
And parameter 2 of the indicator to,
AvgRangeChannel.Plot3 (0,data1,9,2)
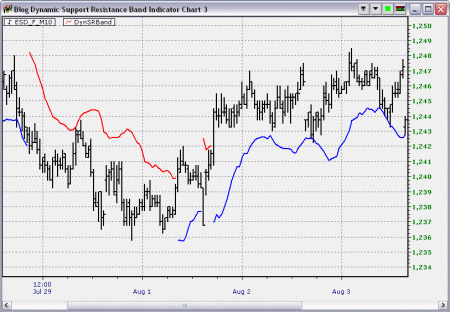
Then you will be able to see how the band looks like with only the significant line left,
Other possible improvements
The indicator I have presented here does not take into account of utilizing a customized reference price comparing against the previous band values (in the visualbreakN statements), thus if you are interested in trying that out, you can modify the comparison to a price formula you want.
Download links
Here is the formula indicator, Dynamic Support Resistance Band.
Share: digg | del.icio.us | Technorati | StumbleUpon
Hi dear
I want Dynamic Support Resistance Band indicator