8
Oddball System – An Update
 OddBall is created by Mark Brown, and was featured in Active Trader magazine. It is a trading system designed for trading the S&P index future (or the emini counterpart). The signal generation of Oddball does not depend on the price data itself. Instead, it is based on the Advance Issues data from NYSE. We originally posted this system’s implementation in NeoTicker and its performance back in 2003.
Here is an update of the current performance of this interesting system.
The Setup
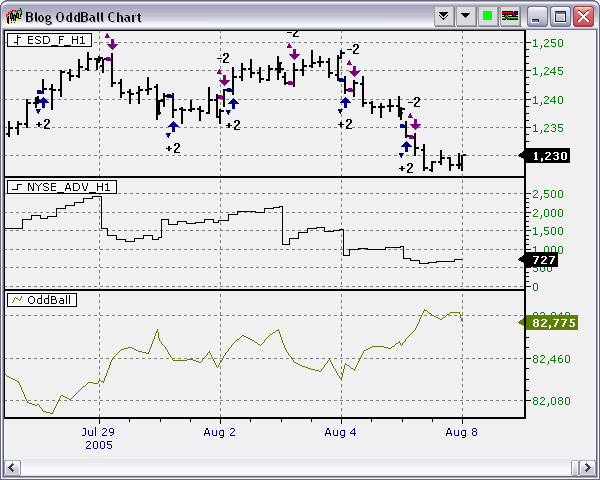
1. S&P or emini S&P Hourly Chart, 9:30 AM to 4:15 PM ET
2. NYSE Advance Issues Hourly Chart
3. Go long when rate of change on advance issues exceeded the prescribed long level
4. Go short when rate of change on advance issues exceeded the prescribed short level
For more detail information on OddBall, here is the link.
The NeoTicker version of OddBall is available here.
Here is a chart of the Oddball System in action,
Performance since 1999
A picture worths a million words, here is the equity curve of the system since end of 1998,
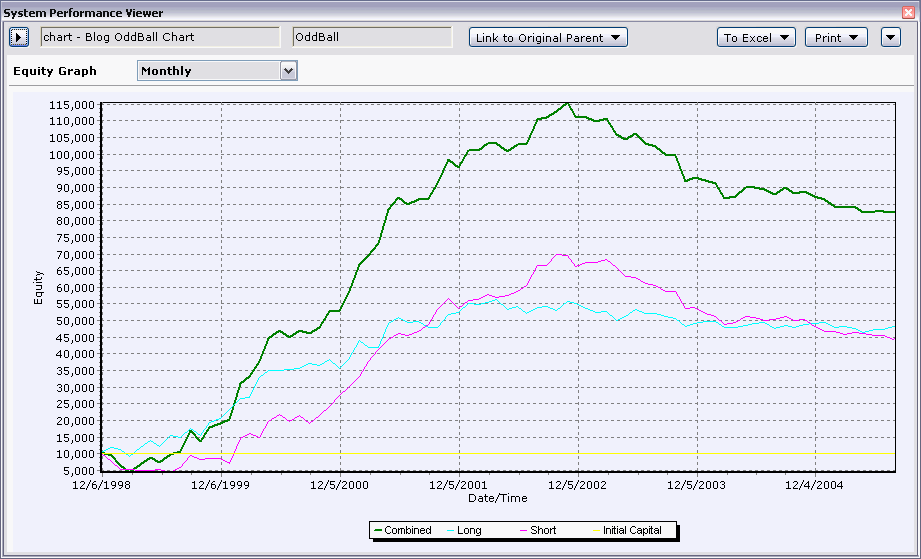
From the picture it is obvious that the system has been in a prolonged draw down period since late 2002. Consider the system was published back in December 2000, it performed extremely well for almost 2 years before the current break down.
What goes wrong?
Lets take a look at the system’s annual performance,
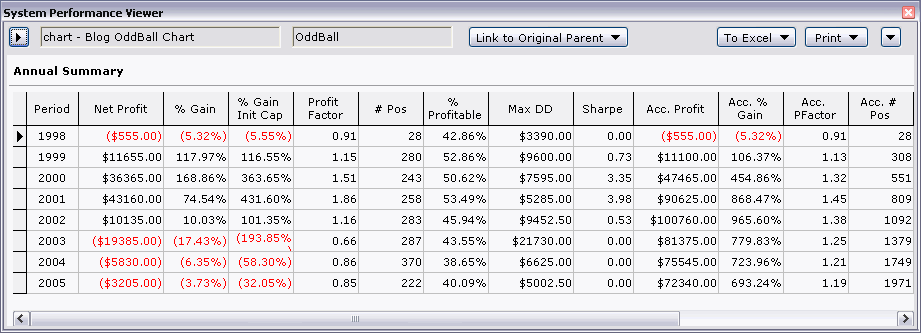
It is obvious that the system has been dropping in percentage of winners since year 2002. It is significantly lower than even the year 1999.
Since then, if you cross check the equity curves above, you would notice the long side only equity is not going anywhere since year 2001. Some may try to argue that year 2000 onward is a down trend market, but that is not a really reliable argument because during year 2000-2001, the system is doing absolutely fine in the long side.
That in combination with the low value in percentage winners, is the sign of a system losing its edge.
Did we have a chance to stop trading the system?
By end of year 2002, if you do consistently check the stability of the systems you trade, you would have put this system on the watch list already, because it is not doing what it supposed to do.
By early year 2003, the drop in percentage winners is so profound, anyone should have stopped trading it because its characteristics is no longer matching the ones we have seen in the backtesting period. As an exercise, you can conduct month by month comparison in the performance statistics then you will see what I mean.
Food for thoughts
As oppose to just throw this system into the garbage bin, is there anything useful that we can reuse?
Maybe incorporating the idea into other trading models to improve the odds?
We will leave that for the next article.
Share: digg | del.icio.us | Technorati | StumbleUpon
Reagrding stability of systems…I would be interested in learning a little more about how one checks/tracks stability of a system. Do you apply a statitical test to make this determination. What other methods are available. When I decide to trade a system, I usually look at the maximum drawdown in my historical testing, generally I do this over a long period of data both in sample and out of sample. I then decide to risk 1.5 to 2 times the max drawdown. I don’t really have a good analytical reason for this choice except that often I can afford that type of risk. As I recall this is an approach suggested in one of Larry Williams’ books. I then figure if I reach that drawdown the system was curve fit or the market charateristics changed. I suppose looking at Monte Carlo type stuff could give me an idea of how much to risk as well and if it’s reasonable to take those risks. Or one could determine based on historical testing how long it would take to double one’s money and then when trading see if you are on track or not, but again not sure how valid of an approach this is.
When you design a trading system, there is usually one to two key properties of the underlying data that the system depends on. If you do not know what that properties or characteristics are, then you do not really know you system 🙂
For example, the OddBall system depends heavily on a 2 to 3 days reversion characteristics of the SP. It also depends heavily on the leading effect of the advance issues data. Thus once those characteristics no long hold true, the system will not work any more. You do not need to wait til the maximum draw down to know that – what you do is track the stability of those characteristics to measure the health of the system. I think I mentioned that in another article – not in the exact same wording, of course.