18
Understanding the Market in a Statistical Way
Have you ever spent time studying how the market you trade behave statistically? Here is an example showing some interesting behaviour that is ignored by many traders.
Share: digg | del.icio.us | Technorati | StumbleUpon
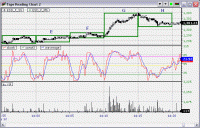 Most beginners in trading heard about the concept of tape reading. Unluckily, there is not much materials available that explains it in details. I hope I can provide some guidance here for our readers to learn the basics of tape reading.
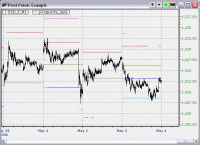 Pivot Points, Floor Trader Pivots, Support / Resistance Levels, etc. are all names for the same set of price levels derived from the previous day, week, or month. They are heavily publicized by financial news channels since the late 1990s as the stock market indices seem to react to these prices magically. I am going to discuss the general usage of this technical analysis technique, and some interesting characteristics that has never been discussed publicly.
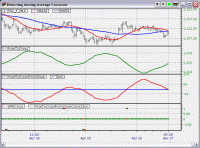 Have you ever wish for the moving averages to crossover earlier? I am going to show you a way to detect moving average crossovers before they actually happen.
 Here is an extremely simple trading system that violates the classic rule of trading, trend is your friend, with very good results. It is an excellent example that illustrates how counter-trend approaches work.
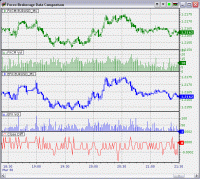 Here is a first look at forex brokerage data on a side by side basis. For many beginners who just started trading Forex, this is a very good introduction into the world of dealer market data.
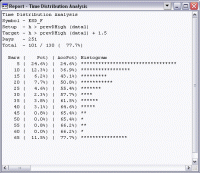 Knowing just your odds with a particular trading setup may not be enough. You need to know the various possible scenarios that may unfold so that you are ready to handle them. Here is a tool that helps you study your trading setups using time distribution analysis.
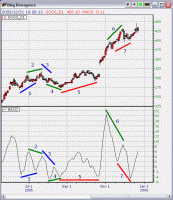 Since the first Basic Chart Reading
 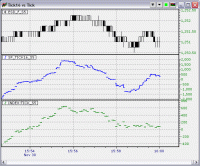 TICK16 is the next generation of the classic breadth indicator TICK index. It offers many advantages over the original index and is much more useful for the current hectic trading environment. I am going to cover some basic usages of this powerful tool.
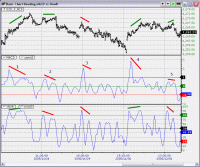 Many beginners try to learn chart reading too quickly, leaving most of the important details behind. I am going to review some of the basic chart reading techniques, hopefully that will help the beginners to read their charts better.