Dec
29
29
S&P 500 Breadth Chart
by Lawrence Chan on Dec. 29th, 2008 in Daily Commentary
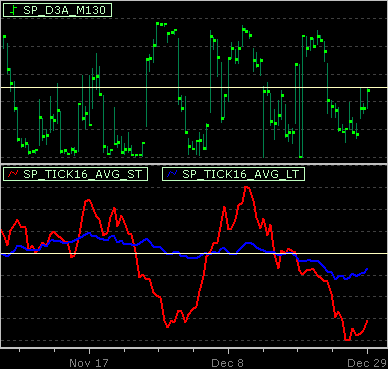
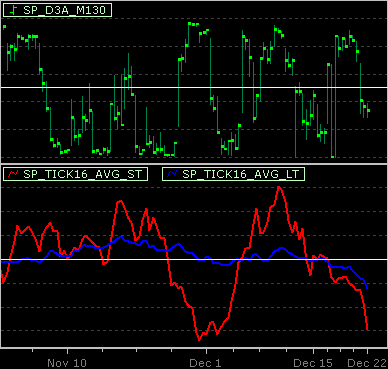
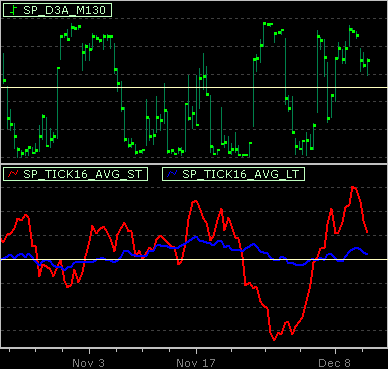
As of 2008 Dec 26 close. Half-day sessions are not included in model.
SP_D3A model : going long next open
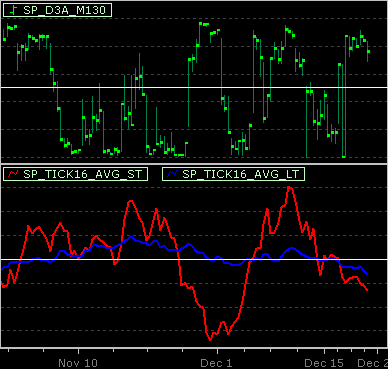
As of 2008 Dec 26 close. Half-day sessions are not included in model.
SP_D3A model : going long next open
Wish you all a very happy holidays!
We at TickQuest would like to say our sincere thanks to our supporters making our products getting better everyday. Thank you.
Best!
p.s. Our office is in holiday mode throughout this time until Jan 2, 2009. Most of our staff are away so if you have an emergency send email to either sales or support, as we monitor that all the time.
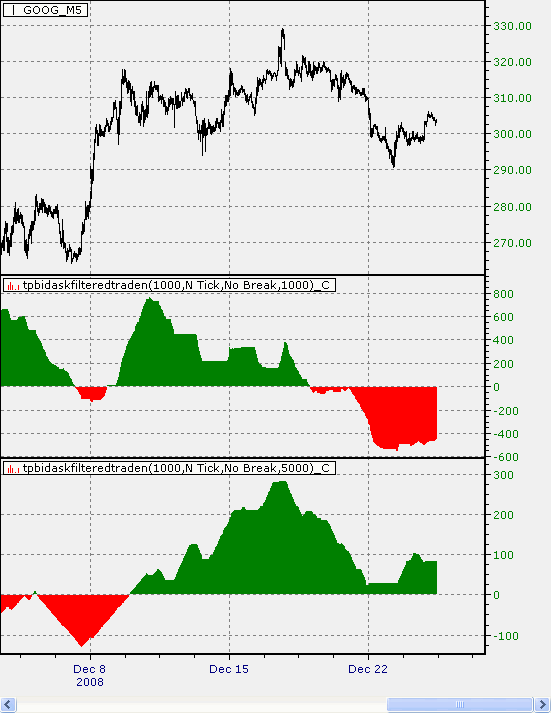
Many people asked why would anyone want to analyze the charts at the tick level. Wouldn’t that be a waste of time since such high frequency activities are not likely going to have any long term impact.
Let’s take a look at this chart first.
Top pane is Google stock price at 5-minute interval, since the beginning of December 2008.
Second pane is, the histogram of the moving score of 1000 trades, where each trade involves at least 1000 shares. A trade at the asking price gets a score of 1, and a trade at the bid price gets a score of -1. As you can see, the result is a momentum indicator providing some insights into the strength of the price series.
Third pane is, the histogram of the moving score of 1000 trades, but each trade involves at least 5000 shares.
Notice how profound that the lowest and highest swing points in the price matched perfectly with the histogram in the third pane.
It is a simple example showing large sized orders, in general, move the market. This information, however, cannot be derived from the price series. One has to dig deep into the tick data to have that extracted.
New Features
– new indicator Standard Deviation by Step
– new indicator Quote Formula Ex
– updated Holiday List for 2009
Bug Fixes
– potential fix to reconnect problem with eSignal once disconnect message is received from eSignal historical tick data connection
– TimeChartData and TimeChartIndicator added safe guard to not retrieve value from a chart when it is busy
– Time Chart global crosshair sometimes project horizontal lines from one pane onto another
– ValidEx in nested indicators failed to return proper info if the plot # is greater than 1