26
Color Volume Bars 1: Basic Volume Bar Color
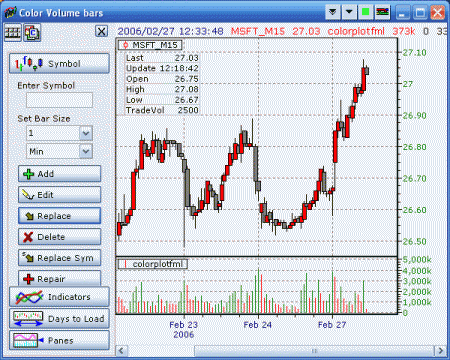
Color volume bar using custom criteria.
Basic knowledge of NeoTicker operation, formula language and indicator is assumed for readers of this example.
Paint volume bars green when current bar volume is greater than previous bar otherwise paint volume bar red.
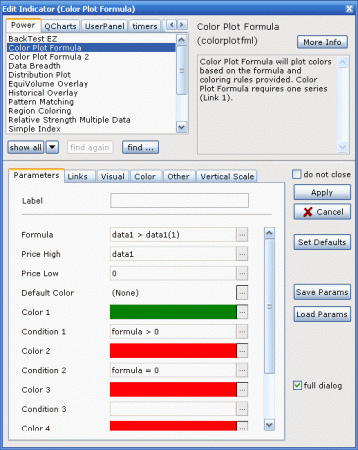
First add data series to chart next add “Color Plot Formula†indicator on the data series, fill in indicator parameters as follow:
Parameters tab:
Formula: data1>data1(1)
Price High: data1
Price Low: 0
Color 1: change to green
Condition 2: formula = 0
Color 2: change to red
Delete formula written in Condition 3 field
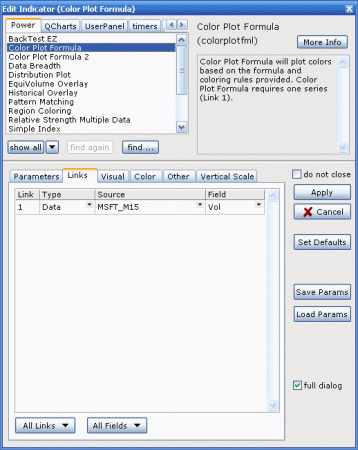
Links tab
Field: Vol
Click on apply button to plot this indicator on the chart.
In link tab, link is set to volume which means data1 in formula field is the current volume bar, volume is chosen as link field because this example deals with volume only.
Formula: data1>data1(1) means compare current bar of default link series (volume) to previous bar. This comparison returns 1 when current bar is greater than previous bar 0 otherwise.
Price High: This is what the indicator will plot as a starting point of bars, it is entered as data1 so volume is the starting point of color bars.
Price Low: This is what the indicator will plot as an end point of bars, it is entered as 0 so the base of a pane with be end point of color bars.
Condition 1 and color 1 entry color bars green when decision written in formula field evaluate to great than zero, which means formula field return true.
Condition 2 and color 2 entry color bars red when decision statement written in formula field evaluates to zero, which means false formula result.
All remaining conditions are left blank so they do not affect color of volume bars.
There will be more volume color plot formula examples coming.
Share: digg | del.icio.us | Technorati | StumbleUpon


