25
VWAP Based Pivots
 Volume Weighted Average Price (VWAP) is widely used by many traders as a reference tool to gauge the market condition. It is also an important tool for traders who execute orders from clients with large blocks. Due to its common usage, VWAP is a very useful indicator for day traders. The odd thing is that not many technical analysis articles talk about VWAP based indicators at all. I will present a few interesting ones here.
What Is Volume Weighted Average Price?
As oppose to normal moving averages that depend on the price series alone, volume weighted average price usually takes the weighted average of a price series together with the corresponding volume series, from a fixed starting point like the beginning of the day (i.e. a current day VWAP), or the start of a year (i.e. the current year VWAP).
Thus VWAP responses to volume more than the price itself. If the market is trading heavily at a particular price, than the VWAP will move towards that price very quickly.
Volume Weighted Average Price Is Not A Single Price Point
Due to variations in data sampling techniques, there are many ways to calculate the VWAP, even with the same basic rules (e.g. start accumulation from current day market open). The most obvious factor affecting the VWAP result is the resolution of the data being used. If you use tick data, then you get the most accurate VWAP as that is the highest possible resolution you can get. On the other hand, most traders do not have access to tick data, either limited by their software application or hardware capacity. Thus they will use data series like 1-min bar, 5-min bar, etc. to approximate the VWAP.
For those who do not use tick data to compute the VWAP, remember that the VWAP based on your sampling technique is no longer an exact price, but an approximation. The precise value for the VWAP will lies somewhere between the extreme points of your sampling data. Thus, you can figure out the highest and lowest possible value for your VWAP by using the high or low price of your data series to figure out the VWAP price band.
Putting It Together Into Indicators
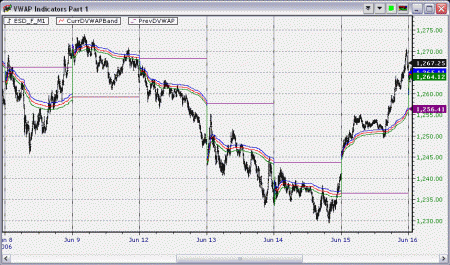
Here is a chart with the indicators I have created.
CurrDVWAPBand is an indicator that calculate the price band of VWAP using high, low and close of the underlying data series. The chart speaks for itself that the band is significant as an important real-time support resistance tool.
PrevDVWAP is an indicator that simply return the previous day final VWAP value as a pivot point. It is an example showing how you can use the indicator formula to construct support resistance type indicators.
CurrDVWAP is not shown in the chart, but included in this article anyway as it is a simple version of the indicator CurrDVWAPBand.
Complete Indicators
Share: digg | del.icio.us | Technorati | StumbleUpon

How do I chart this?
Download and install indicator from the link provided above, then you can chart these indicator in NeoTicker.