10
Using NeoTicker with Excel Part 2
Overview
To create highly presentable technical analysis chart has been a complex and tedious task for years. With NeoTicker®, you can simply send your chart data and technical indicators into Excel for presentation formatting. By utilizing Excel’s capability in presentation graphics, you can create high impact presentation easily.
Step by Step Guide
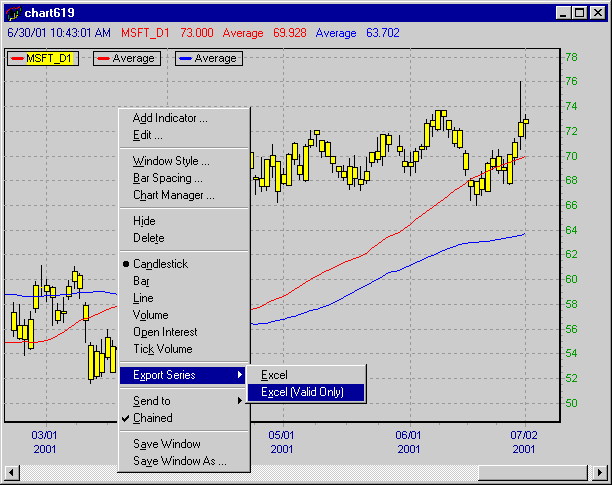
1. Create or load your chart window. Select each data series and indicator you want to present, and send it to Excel using the popup menu.
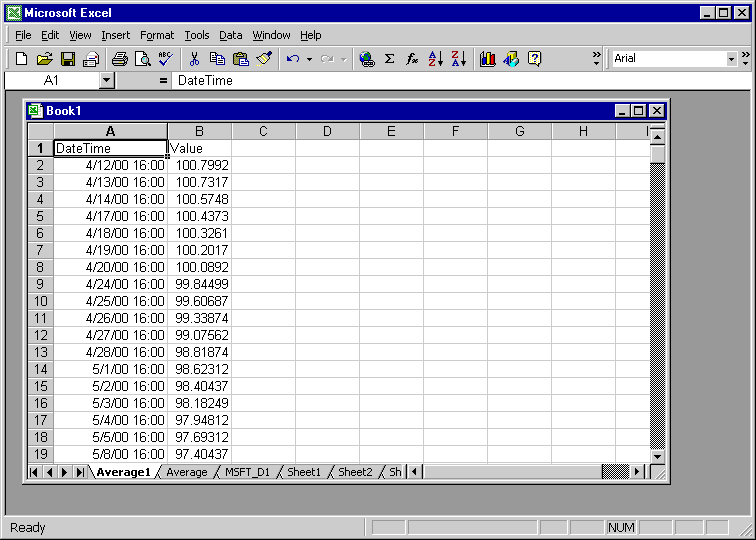
2. The data and indicator values are now stored in an Excel workbook ready for your usage. You can apply additional changes to further format the data.
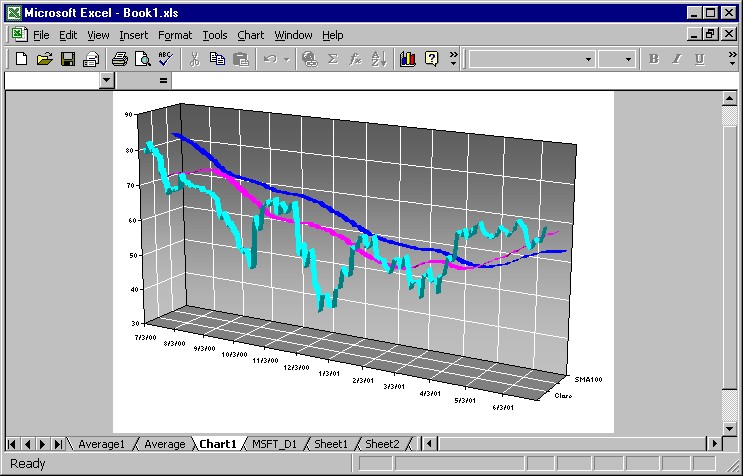
3. The completed presentation chart can be printed in slides for projects or integrated into a PowerPoint project.


