21
Archive for February, 2008
11
Introducing Add-on for NeoTicker
We’ve decided to add a special category for add-on tools that work with NeoTicker. Spreadsheets, small applications, etc. designed to work with NeoTicker will be posted under this category.
9
S&P 500 Breadth Chart
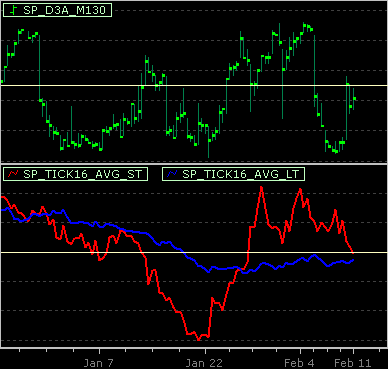
As of Feb 8, 2008 close.
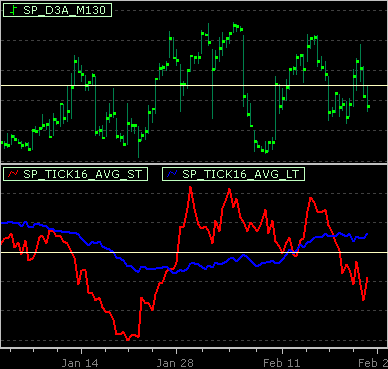
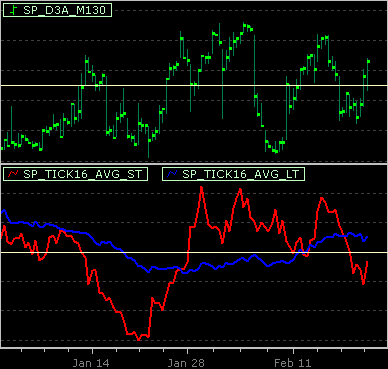
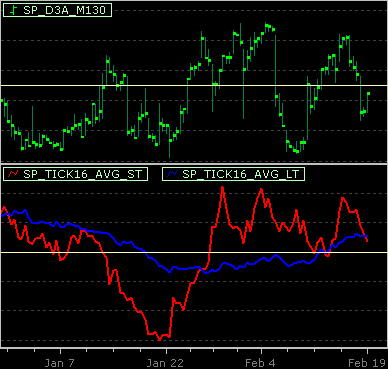
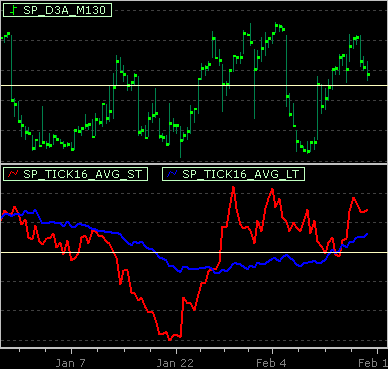
The short term TICK16 is moving towards the neutral zone (the horizontal zero line), placing it at a critical juncture. If it can bounce off from this level, as oppose to moving downward (like in Jan), a serious rise of the stock indices can be expected.
9
Having our own daily commentary
Due to heavy demand by users of NeoTicker and readers of articles I have written, I will start posting charts with interesting breadth data.
The first ones are the 3-day advance issues and the extreme readings of TICK16, both collected on S&P 500 components. I have written an article on using 3-day advance issues in a basic intraday trading system, you can locate the article through Futures magazine.
For TICK16, although it is in use by many users for daytrading, I have not really spent time on explaining what it can do comparing to the classic $TICK index. It is on my to do list and I will have it done soon.
