Archive for August, 2009

Aug
29

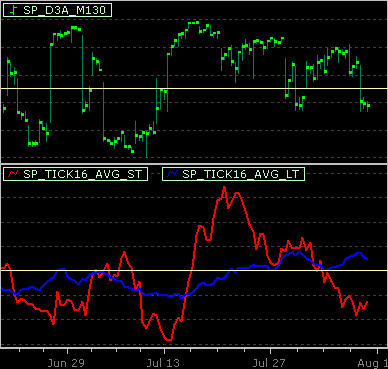
S&P 500 Breadth Chart

sp500breadth_20090829_145316

As of 2009 Aug 28 close.

SP_D3A model : short

What are SP_D3A and SP_TICK16?

Aug
26

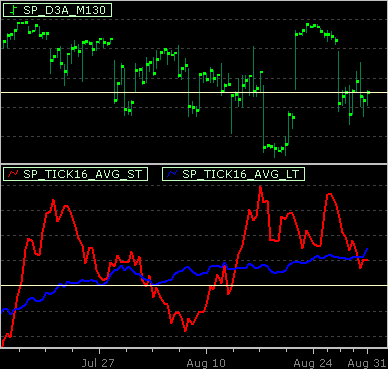
S&P 500 Breadth Chart

sp500breadth_20090826_160652

As of 2009 Aug 26 close.

SP_D3A model : going short

What are SP_D3A and SP_TICK16?

Aug
21

Getting Backfill Data

This article show how to get backfill symbol from TickQuest backfill server.
Continue Reading…

Aug
20

S&P 500 Breadth Chart

sp500breadth_20090820_162649

As of 2009 Aug 20 close. Extreme reading.

SP_D3A model : long

What are SP_D3A and SP_TICK16?

Aug
13

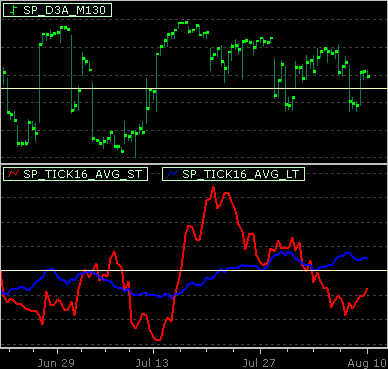
S&P 500 Breadth

sp500breadth_20090813_163329

As of 2009 Aug 13 close.

SP_D3A model : long

What are SP_D3A and SP_TICK16?

Aug
12

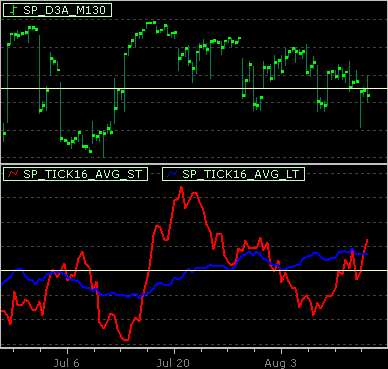
S&P 500 Breadth Chart

sp500breadth_20090812_163126

As of 2009 Aug 12 close.

SP_D3A model : long

What are SP_D3A and SP_TICK16?

Aug
9

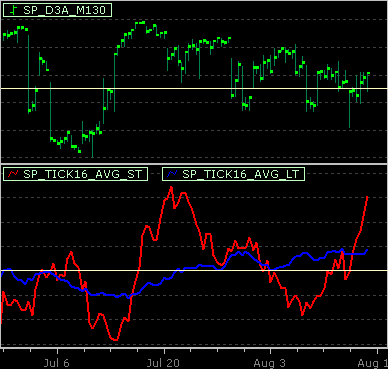
S&P 500 Breadth Chart

sp500breadth_20090809_135536

As of 2009 Aug 7 close.

SP_D3A model : going long

What are SP_D3A and SP_TICK16?

Aug
8

Formula 201 – #17 Relative Price Indicator

Relative Price indicator is an example indicator demonstrating one of the less known technical analysis techniques called Relative Price Analysis.

I will explain what Relative Price Analysis is with several examples.

You can download the indicator here, relativeprice.for
Continue Reading…

Aug
6

Formula 201- #16 Multi Time Frame Inside Bars

This formula indicator example show how to conduct multiple time frame statistic research, with printed format result output to report window.
Continue Reading…
Aug
6

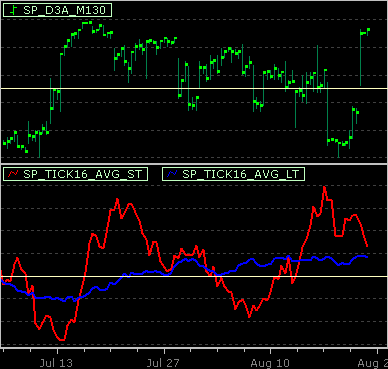
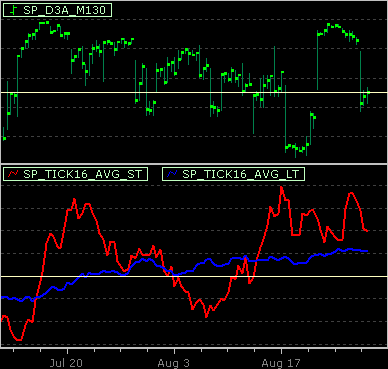
S&P 500 Breadth Chart

sp500breadth_20090806_161943

As of 2009 Aug 6 close.

SP_D3A model : short

What are SP_D3A and SP_TICK16?

Blog Developed
By ContentRobot