29
Archive for January, 2009
27
Emini S&P Volume Breakout System with Multiple Timeframe Filters
This is the trading system I presented in Futures magazine, Feb 2009 issue.
Data Setting
1. 5-min ES
2. 9:30 to 16:00 ET
Download
25
Article to be published in Futures magazine
24
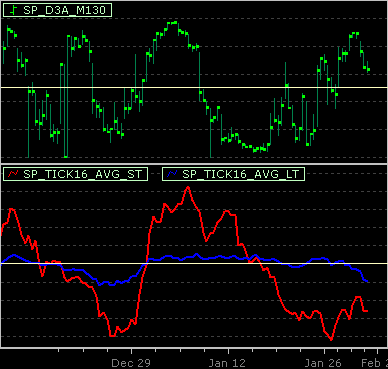
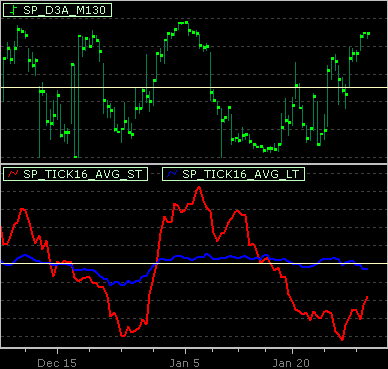
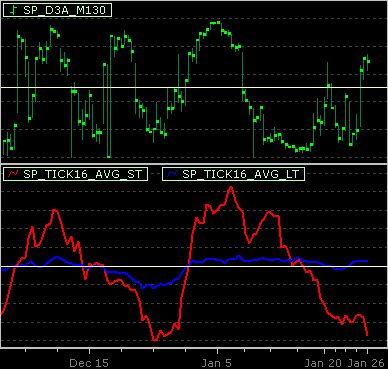
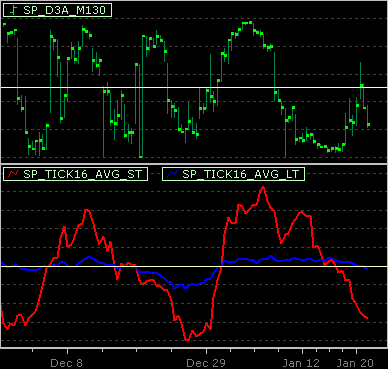
S&P 500 Tick16
I wrote an article in the Futures magazine some time ago on S&P 500 Tick16 Index and a basic daytrading system that exploit the statistical bias on the index. Here is some supplement information about the concepts.
What is S&P Tick16 Index?
The classic NYSE TICK Index is the summation of a binary function over the last trade of each instrument traded at least once on the day.
Continue Reading…
22
Cone Projection
An example of using the Cone Projection indicator in real-life.
Emini S&P 5-minute with 100 days of data loaded. Cone Projection parameter using daily break, lookback period of 90.
What does the indicator do?
It utilizes the moving average by step indicator to figure out the potential high/low at any point in time at the chosen break period. In our example, it figures out how far on average the price would move from open of the day to any particular point in time.
The red lines are the averages and the blue lines are 1 standard deviation away.
How to use the indicator?
The indicator provides a projected path of support and resistance over time based on your break criteria. In the example, the projection is based on Day break, thus you can see the projection for the whole trading day beforehand.
For a range bounded day, travelling from one end of the average to the other often signal completion of a move, as illustrated by the 2nd and 3rd day in the chart.
For a trending day, the market will stay between the average and the one deviation zone, as in the first day shown in the screenshot.
20
NeoTicker 4.20 Build 46
New Features
– IQFeed 4.4.x.x or higher user specified port settings are now recognized
– Trading system core optimized to handle position updates and equity calculations much faster when there are excessive amount of invalid bars in the underlying data series
– System Performance Viewer revised to more effectively using memory for the generation of equity graph
– new indicator Cone Projection
Bug Fixes
– DDE feed based on eSignal Data Manager 10 not working
– System Performance Viewer, switching equity graph resolution to as-is, while there are too many data points to handle, can lead to crash
– eSignal multiple disconnect triggered when user is accessing historical tick data intensively
18
An Excel Worksheet on Trading Performance
Many traders learned the importance of keeping records of all their trades. There are even software to help you analyze your performance by compiling tons of statistics, etc. I have here a simple spreadsheet that I think will be useful no matter you are a system or discretionary trader.


