Archive for February, 2009

Feb
26

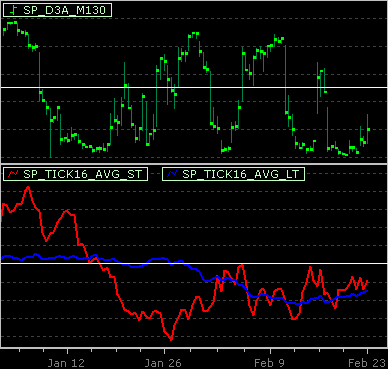
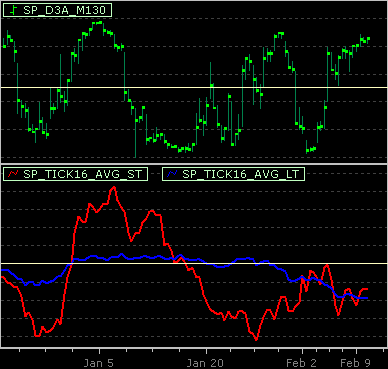
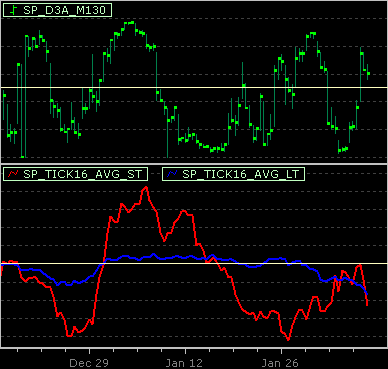
S&P 500 Breadth Chart

sp500breadth_20090226_162903.gif

As of 2009 Feb 26 close.

SP_D3A model : long

What are SP_D3A and SP_TICK16?

Feb
23

Open E Cry Order Server 1.40 Released

New Features

Added support of OEC API 3.3.0.0

Feb
20

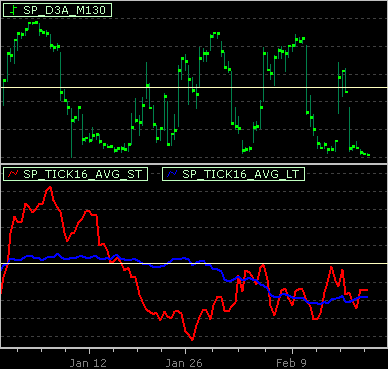
S&P 500 Breadth Chart

sp500breadth_20090220_170217.gif

As of 2009 Feb 20 close.

SP_D3A model : long

What are SP_D3A and SP_TICK16?

Feb
18

Performance Sensitivity

For most traders, when tracking their own performances, or measuring the performance of trading systems, a tendency is to look for almost perfect improvement over time. We always want the performances to get better, stay in top shape, etc. In reality, such push can be harmful and can backfire.

Attached is an Excel spreadsheet showing the potential reason why and how to monitor trading performances using a relaxed condition that works well over the long term.

The Spreadsheet
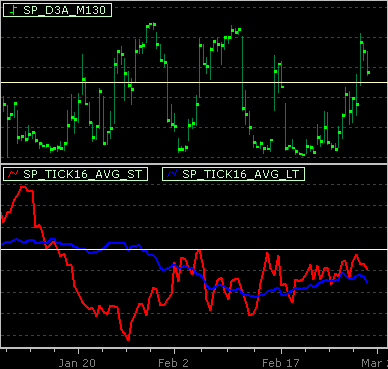
systemsensitivitystudy.xls
Continue Reading…

Feb
18

S&P 500 Breadth Chart

sp500breadth_20090218_160321.gif

As of 2009 Feb 18 close. Extreme reading.

SP_D3A model : long

What are SP_D3A and SP_TICK16?

Feb
17

S&P 500 Breadth Chart

sp500breadth_20090217_160510.gif

As of 2009 Feb 17 close. Extreme reading.

SP_D3A model : going long

What are SP_D3A and SP_TICK16?

Feb
12

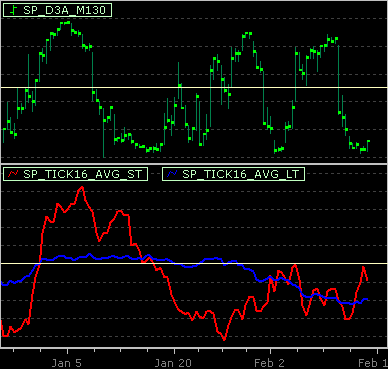
S&P 500 Breadth Chart

sp500breadth_20090212_163647.gif

As of 2009 Feb 12 close. Extreme reading.

SP_D3A model : short

What are SP_D3A and SP_TICK16?

Feb
10

S&P 500 Breadth Chart

sp500breadth_20090210_160438.gif

As of 2009 Feb 10 close.

SP_D3A model : going short

What are SP_D3A and SP_TICK16?

Feb
9

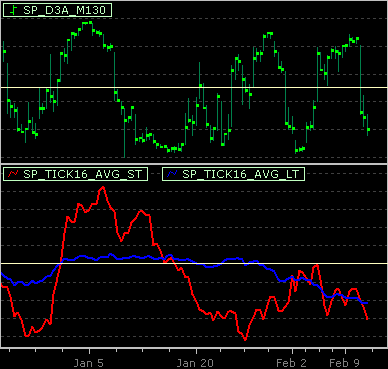
S&P 500 Breadth Chart

sp500breadth_20090209_161842.gif

As of 2009 Feb 9 close. Extreme reading.

SP_D3A model : long

What are SP_D3A and SP_TICK16?

Feb
4

S&P 500 Breadth Chart

sp500breadth_20090204_162532.gif

As of 2009 Feb 4 close.

SP_D3A model : going long

What are SP_D3A and SP_TICK16?

Blog Developed
By ContentRobot