28
25
S&P 500 Breadth Chart
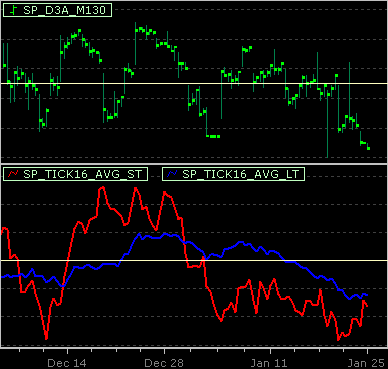
As of 2010 Jan 22 close. Extreme low reading.
SP_D3A model : short
What are SP_D3A and SP_TICK16?
Notes: We are in the process of reorganizing our websites thus less frequent update of the breadth chart. And yes, the model is still in the same short position.
7
Howto Download and Import Historical Data
This article is a step by step guide that shows how to import historical data files downloaded from TickQuest website customer area in to NeoTicker.
Continue Reading…
4
Formula 201 – #18 Memory Effect
This example show how formula language store value in a specific time of day, or when a specific condition occur. These two coding examples can be used in place of BarSince or Reftime indicator which takes up more resources, implementation is done by utilizing if function and a single slot holder local variable.
What the code does is monitor specific condition with if function, when condition is valid replace value stored in holder variable else retain previous value.
Continue Reading…
31
We wish you all a Happy New Year!

New Year’s Eve is upon us … farewell to 2009.
We wish all our clients and colleagues a Happy New Year!!!
21
Howto Build Calculated Symbols 2
This time around I will show how to build a spread symbol and a completely new method to fill in historical calculation that better emulate real time data building using lower time frame and compress series calls.
Continue Reading…
20
S&P 500 Breadth Chart
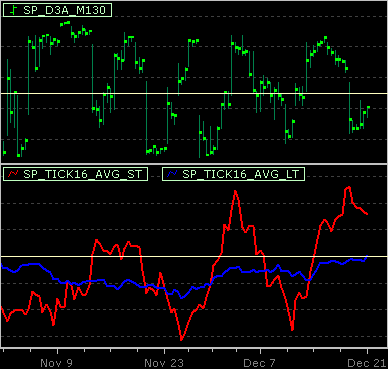
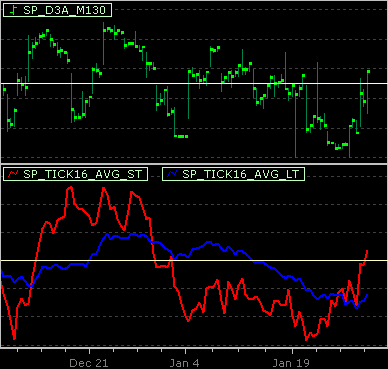
As of 2009 Dec 18 close. Extremely close to switching back to neutral from bearish bias with the Tick 16 filter.
SP_D3A model : short
17
Volume Profile in Table Format
NeoTicker has ability to capture trades tick by tick and heap object has a price profiling function that allow indicator to store price and volume pair within heap, by combining these two aspect I can easily code an indicator that shows tick based trading volume at different price level in table format.
Continue Reading…
16
TASC Traders’ Tips: Vortex Indicator
This is vortex indicator from January 2010 issue of Technical Analysis of Stocks and Commodities magazine.
Right click and select save as to download the following indicator to your local hard disk, then at NeoTicker main menu select Program> Indicator Manager and click on Install Indicators button to the indicator file.
Name of the indicator will show up in add indicator window as TASC Vortex Indicator
Download
Vortex Indicator (tasc_vortex.for)
11
Howto Build Calculated Symbols
Calculated symbols are symbols base on modifying underlying data, resulting data can be used as regular data series for real-time or historical data analysis.
NeoTicker user defined symbols provide real-time custom calculated data series, historical data for these calculated symbols can be filled in with calculated cache data.
Continue Reading…
